8.8 KiB
BMW Monaco
Dynatrace - Get Started!
Initial Setup
To monitor your application with Dynatrace, please follow these steps:
-
Make sure you have access to Dynatrace. If not, follow this link
-
Clone this repository in your local machine:
git clone https://atc.bmwgroup.net/bitbucket/scm/opapm/cd_e2e_monitoring_config.git -
Create a branch using your Component/Application name with the following format:
git checkout -b CD_<app_name>What value should i use for <app_name>?
- Azure Runtime: i.e. for vehicle-composite-service you need to get this value.
- Orbit: coming soon!
- Openshift: coming soon!
-
Execute the script passing as parameters, again, the <app_name>:
./onboard.sh CD_<app_name> <app_name> -
(optional) Configure Notification System
- Dynatrace AI automatically detects anomalies in your applications and generate problems, visible within the UI. Dynatrace offers several out-of-the-box integrations with problem notification systems such as Email, MS Teams and ITSM.
- Notification systems are not configured by default. If you want to enable them for your application, please follow this link.
-
(optional) Add databases to Management Zone
- The script described in step 5 will create the configuration for all entities related to your application (Host, Processes, Services) but not the databases.
- To add your databases into Dynatrace you need to add an extra rule to the Component.json file. You can use this example to understand exactly what you have to do.
-
Commit and pull request to merge the branch to the master:
git add <changes>
git commit -m "<app_name> configuration changes"
git push -u origin <branch>
Results
Important
- Configuration changes (like in dashboards, alerting profiles) must be done via a pull request. Changing a dashboard just in the environment, will cause that it will be overwritten by Monaco.
- Once the pull request is approved and BMW Monaco executes, all the configuration created in the previous steps will be visible in Dynatrace:
Primary Configuration
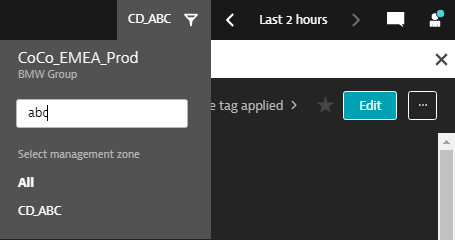
- Management Zone
- Used to filter entities.
- Can be used to navigate the environment, filtering within dashboards and alerting profiles.
- You can use the generated MZ clicking on the filter at the top-right corner within the Dynatrace UI.
- Learn how to configure/improve your Management Zone here (Do i need to configure it?)
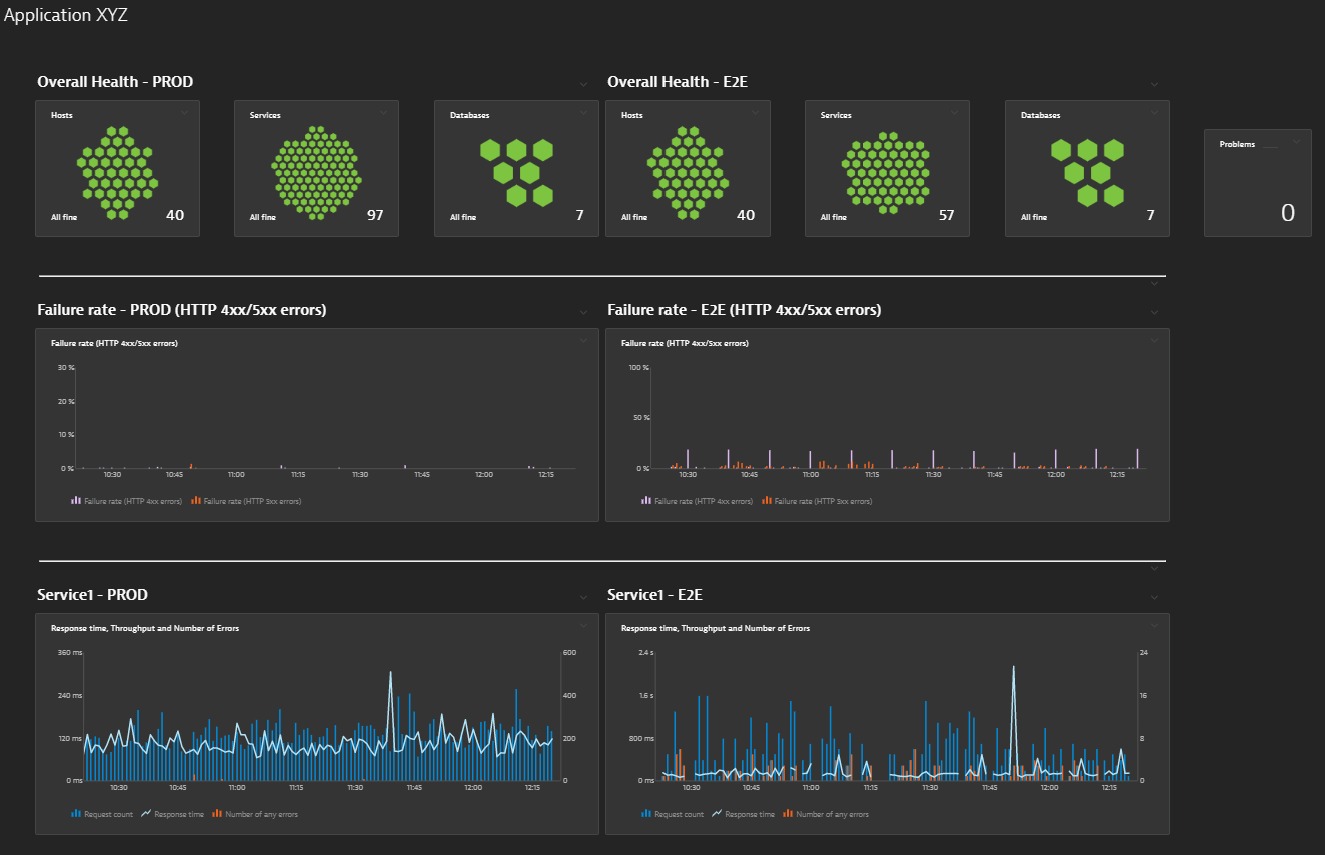
- Dashboards
- Based on a template,
- Initial dashboard with a general overview of the health of the application.
- For Prod environements, PROD and E2E dashboards will be generated.
- For PreProd environments, INT dashboard will be generated.
- Learn how to configure/improve your Dashboards here (Do i need to configure it?)
-
Alerting Profiles
- Used to filter specific problems related to your applications.
- For Prod environements, PROD and E2E alerting profiles will be generated.
- For PreProd environments, INT alerting profiles will be generated.
- Learn how to configure/improve your Alerting Profiles here (Do i need to configure it?)
-
Notification System
- For each Alerting Profile, it's possible to set up a separate Notification System.
- For Prod environements, PROD and E2E notification systems will be generated.
- For PreProd environments, INT notification systems will be generated.
- Notification system is not configured by default. If you want to enable it for your application please follow this link.
- Learn how to configure/improve your Notification System here (Do i need to configure it?)
Optional Configuration
The following configuration items are not set up by default. Learn the value that can provide to monitoring within the Dynatrace documentation (links shared below on each item) or in one of our trainings (recommended, BMW specific)
- (optional) Custom services
- Short description: If your application services aren't built on standard technologies, they may not be recognized out-of-the box. You can monitor these technologies, but you'll need to define them as custom services with specific service entry points. Another use case for custom services are microservices that are used by a larger application that aren't exposed via communication technologies.
- How to configure it in monaco?
- Custom services - Dynatrace Documentation
- (optional) Request Attributes
- Short description: Dynatrace tracks all requests, from end to end, and automatically monitors the services that underlie each transaction. The performance and attributes of each request can be analyzed in detail. You can even create custom multi-faceted filters that enable you to analyze call sequences from multiple perspectives. With such advanced request filtering, Dynatrace enables you to slice and dice your way through your requests to find the proverbial “needle in the haystack.” Such filtering isn't only possible on certain predefined attributes. You can also configure custom request attributes that you can use to improve filtering and analysis of problematic web requests.
- How to configure it in monaco?
- Request Attributes - Dynatrace Documentation
- (optional) Custom metrics
- Short description: Dynatrace out-of-the-box metrics generally focus on availability, failure rate, and performance. The multidimensional analysis view for service and custom metrics that enables you to define custom analysis views around use cases that leverage request attributes as metric sources.
- How to configure it in monaco?
- Custom metrics - Dynatrace Documentation
- (optional) Synthetics
- Short description: Dynatrace Synthetic Monitoring makes it easy for you to monitor the availability and performance of your applications as experienced by your customers around the world and around the clock. Availability is the success rate at a given instant or time period that indicates if your application is fully functional and available to users.
- How to configure it in monaco?
- Synthetics - Dynatrace Documentation
- (optional) Naming Rules (Services / Process Groups)
- Short description: Dynatrace automatically detects and names your applications’ server-side services based on basic properties of your application deployment and configuration. These properties and the resulting service names should be intuitive to you because they reflect your service landscape. In some cases however, the default naming scheme may not be to your liking or may not adequately reflect your service landscape. In other instances, you may want to add certain process or service metadata to a service name to improve usability.
- How to configure it in monaco?
- Naming Rules - Dynatrace Documentation
Recommended
- Participate in one of the Dynatrace trainings to understand:
- How to use Dynatrace in the most efficient way.
- What kind of changes in the configuration are possible and how will improve monitoring.
- Hands on in how to work with Monaco (Dynatrace Configuration as Code)