4.0 KiB
BMW Monaco
Dynatrace - Get Started!
As the Runtime cluster is instrumented with dynatrace automatically no further actions are needed.
Initial Setup
To monitor your application with Dynatrace, please follow these steps:
-
Make sure you have access to Dynatrace. If not, follow this link
-
Clone this repository in your local machine:
git clone https://atc.bmwgroup.net/bitbucket/scm/opapm/cd_e2e_monitoring_config.git -
Create a branch using your Component/Application name with the following format:
git checkout -b CD_<app_name>What value should i use for <app_name>?
- i.e. for vehicle-composite-service you need to get this value.
-
Execute the script passing as parameters, again, the <app_name>:
./onboard.sh CD_<app_name> <app_name> -
(optional) Configure Notification System
- Dynatrace AI automatically detects anomalies in your applications and generate problems, visible within the UI. Dynatrace offers several out-of-the-box integrations with problem notification systems such as Email, MS Teams and ITSM.
- Notification systems are not configured by default. If you want to enable them for your application, please follow this link.
-
(optional) Add databases to Management Zone
- The script described in step 5 will create the configuration for all entities related to your application (Host, Processes, Services) but not the databases.
- To add your databases into Dynatrace you need to add an extra rule to the Component.json file. You can use this example to understand exactly what you have to do.
-
Commit and pull request to merge the branch to the master:
git add <changes>
git commit -m "<app_name> configuration changes"
git push -u origin <branch>
Results
Important
- Configuration changes (like in dashboards, alerting profiles) must be done via a pull request. Changing a dashboard just in the environment, will cause that it will be overwritten by Monaco.
- Once the pull request is approved and BMW Monaco executes, all the configuration created in the previous steps will be visible in Dynatrace:
Primary Configuration
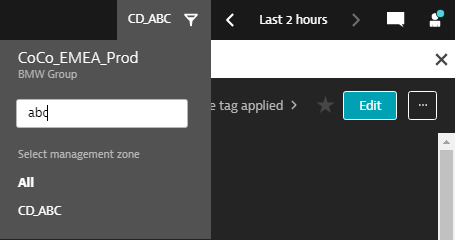
- Management Zone
- Used to filter entities.
- Can be used to navigate the environment, filtering within dashboards and alerting profiles.
- You can use the generated MZ clicking on the filter at the top-right corner within the Dynatrace UI.
- Learn how to configure/improve your Management Zone here (Do i need to configure it?)
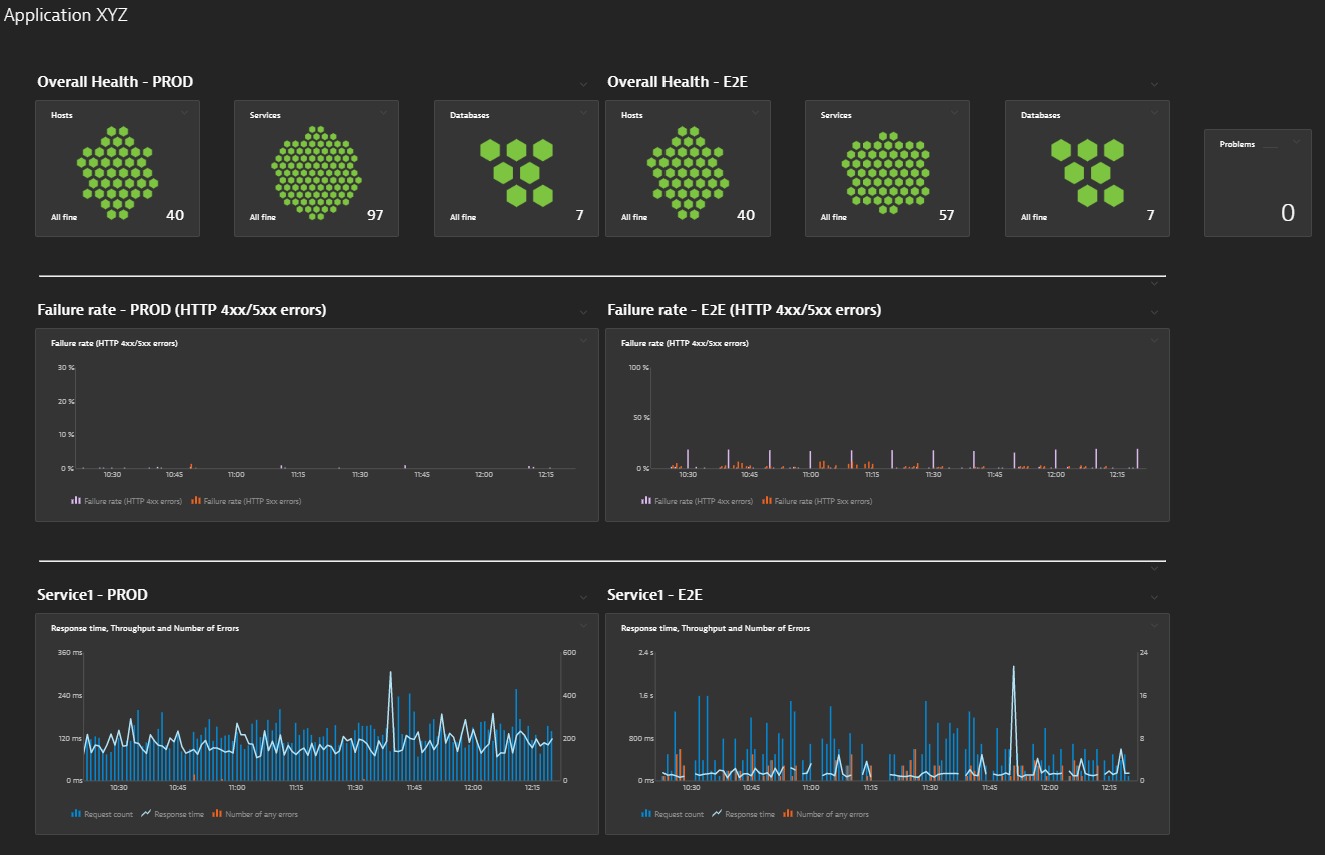
- Dashboards
- Based on a template,
- Initial dashboard with a general overview of the health of the application.
- For Prod environements, PROD and E2E dashboards will be generated.
- For PreProd environments, INT dashboard will be generated.
- Learn how to configure/improve your Dashboards here (Do i need to configure it?)
Recommended
- Participate in one of the Dynatrace trainings to understand:
- How to use Dynatrace in the most efficient way.
- What kind of changes in the configuration are possible and how will improve monitoring.
- Hands on in how to work with Monaco (Dynatrace Configuration as Code)